RCATP: Risk-Controlled Ambient Thermal Profiles
Why Temperature Sensitive Packaging is Critical

Major concerns for manufacturers and shippers of temperature-sensitive products include product loss or damage and the associated risks of shipping goods through the supply chain.
The Eighth UPS Pain in the Chain Survey from UPS, a global leader in logistics, discussed exactly how critical this issue is and how important packaging is with healthcare logistics executives, and this is how they responded:
- 63% of the executives surveyed believe that a core supply chain issue is product damage and spoilage.
- 47% say that increasing regulatory requirements involving cold-chain or temperature-sensitive packaging are driving up costs.
- 48% stated that their success in attempting to control product damage and spoilage is with thermal packaging and containers.
Clearly, thermal tertiary packaging can play an important role in protecting the quality of temperature-sensitive products as they move through the supply chain. However, this kind of packaging is often either over- or under-engineered, which can increase supply chain costs and decrease product quality and efficacy. Understanding the effects of temperature in the in-transit environment can help to improve the design of tertiary packaging that protects products from adverse temperature variances and help to reduce supply chain costs and lessen overall risk.
Why the right packaging is important
Adverse heat gain or loss by exposure to ambient temperature over time during shipping can affect the ability of a temperature-sensitive product or its packaging to withstand temperatures that exceed a defined ideal range. Exposure to temperatures outside of a product’s ideal range can impact product quality and efficacy.
When products or packaging are compromised, there are costly ramifications, including those associated with the manufacturing of replacement products, pack-out assembly and transportation. In addition, there could be loss of retail revenue, along with other related expenses such as quarantine, testing, disposal and brand equity damage. A worst-case scenario is if compromised product reaches the consumer.
How proper packaging can help
Thermal tertiary packaging, which protects goods during shipping with materials such as corrugated boxes, insulating materials, and phase-change materials, can effectively reduce many of the risks noted above.
To design optimal tertiary packaging, it’s important to determine what an ideal and acceptable shipping time and temperature range is for the specific tolerances of a particular product. Packaging designers can then use this data, along with other design considerations, to develop shipping materials that have the greatest potential to maintain product temperatures when exposed to ambient temperatures in the real world.
Factors such as shipping lane, time of year, and level of shipping service can result in an extremely wide range of ambient temperatures, from as high as 60°C to as low as -20°C.
This is where a Risk-Controlled Ambient Thermal Profile (RCATP), a methodology developed by Sensitech® Inc., comes in. It provides a statistical analysis of time-temperature data during the phase of packaging design where thermal packages are tested in a temperature-controlled chamber.
By collecting an appropriate dataset of time and temperature data via an RCATP, packaging designers can analyze the distribution of expected temperatures in a particular shipping network, then predict and quantify the potential thermal risk.
Packaging designers can use the data in this analysis as parameters for creating packaging prototypes that can maintain a specified temperature range of both temperature and time that will help reduce risk.
The differentiating method of an RCATP
Supported by Newton’s law of cooling, Sensitech’s RCATP approach uses a risk-weighted evaluation of variable temperatures as a means of quantifying the risk of a temperature excursion. It provides a more comprehensive analysis of time and temperature data from a shipping network than most Ambient Temperature Profiles (ATPs)—and here’s why.
Typically, ATP data is collected for creating ‘hot’ and ‘cold’ season profiles to minimize the cost of packaging and identify when it is appropriate to transition from packaging for a hotter or colder season. However, most ATP methodologies don’t show what happens on a cold day in a hot season, or a hot day in a cold season, as they don’t measure the full range of temperatures during a season.
To provide a more comprehensive insight, the RCATP methodology uses two profiles, or a profile set. The two profiles in a set contain one profile representing the upper or hottest expected trip, and a lower profile representing the coolest expected trip. Armed with this comprehensive data, package testing can be on the full range of temperatures—both highs and lows—that can occur within one season or across multiple seasons. The RCATP methodology gives packaging designers a higher level of confidence that the chamber-tested packaging will withstand all ambient temperatures within a given supply chain.
The benefits of the two-profile approach
The two-profile approach of an RCATP analysis provides significant benefits over other methodologies:
- More comprehensive. As a consultative process, the RCATP methodology helps companies consider a wider array of variables than other approaches. An RCATP analysis can potentially include data on product stability, product cost, process cost, distribution options and service levels, as well as packaging and design costs.
- Better cost/risk analysis. With the RCATP methodology, companies can assess product failure and excess logistics costs while minimizing the total cost of distribution. For example, an RCATP analysis allows companies to measure the cost of maintaining quality by providing protection via thermal packaging and specialty logistics services. Companies can compare the cost of such protection against the risk and projected costs associated with product quarantine or loss due to the negative effects of thermal exposure.
- Greater insights into acceptable risk levels. An RCATP analysis can also help companies define their supply chain requirements to determine what kinds of investments are needed to maintain product quality, consumer safety and regulatory compliance. Companies can identify and weigh various trade-offs, and intelligently define the level of variability or risk they are willing to take. For instance, companies can determine what an acceptable level of risk is for a specific distribution network, and create an iterative package design process to help optimize distribution costs against an informed risk tolerance. This approach can also inform a variety of choices in designing other factors in a distribution system, such as the selection of lane clusters, transportation mode, and shipping service levels.
How the Sensitech RCATP Methodology Works
Major concerns for manufacturers and shippers of temperature-sensitive products include product loss or damage and the associated risks of shipping goods through the supply chain.
This blog provides a deeper look at Sensitech’s RCATP methodology. Here, there is an exploration of the three primary concepts: ideal temperature, heat value and trip length, or time in transit. These are the key components in an RCATP analysis that together help manufacturers reduce risk in the supply chain.
First, here is a quick overview of each of these concepts and how they work together to provide thermal risk intelligence through an RCATP.
1. Ideal temperature
The RCATP methodology relies on creating an arbitrary temperature that represents the optimum temperature at which a product should be stored to maintain optimal efficacy. For many life science products, this might be based on a “label claim” temperature that meets regulatory compliance, which is typically 2-8°C. The optimum or ideal temperature for this range is typically agreed to be 5°C, as it represents the mean of the two limits. Therefore, an ideal temperature for many life sciences products often uses 5°C.
2. Heat and negative heat values
A defining feature of the RCATP methodology is the ability to compare various shipments, or trips, to one another and to average ATPs. For these trip comparisons, the RCATP methodology utilizes two statistically derived metrics called “heat value” and “negative heat value.” These calculations quantify the amount of heat associated with a specific trip or profile, or any time-temperature series.
The heat value and negative heat value measure the difference between a time and temperature series and the selected ideal temperature (see Figure 1). Typically these metrics would be calculated on a cohesive data set of a single shipping lane or grouping of lanes.

Figure 1: The gray area in the left graph shows a trip’s heat value, or the amount of time above the ideal range. The graph on the right shows the negative heat value, or the time below the ideal temperature, for the same trip.
In Figure 2 below, the positive and negative heat values from five different shipments are depicted. The most extreme trips from the dataset, using heat and negative heat, have been highlighted in red and blue respectively, in the right section of Figure 2. For instance, the metrics show that Trip 5 had a more extreme negative heat value than Trip 1, while Trip 4 has a more extreme heat value than any other trip. This set of heat values becomes critical when deciding the risk level of each RCATP.
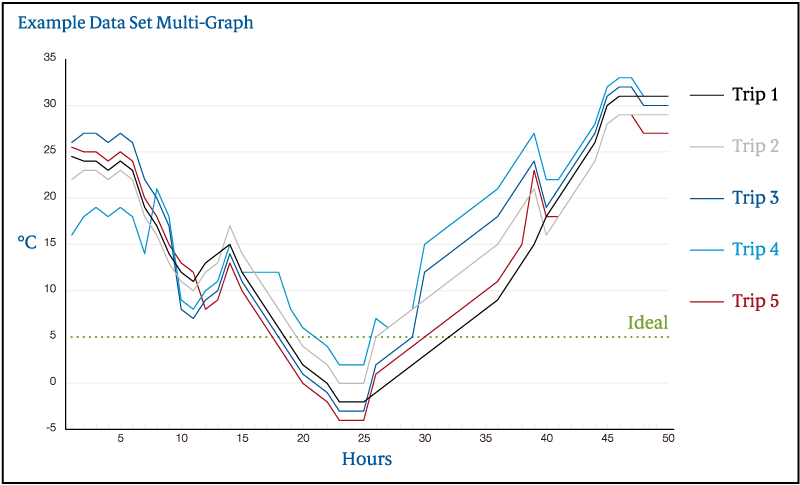
Figure 2: Each of the time-temperature records for five separate trips has a heat and negative heat value which can ultimately inform the high and low profiles in an RCATP profile set.
3. Trip length (or time in transit)
When undertaking an RCATP analysis, companies must decide length of the thermal profile. Typically, for the shipment of small packages, this would be anywhere from 24 to 120 hours, depending on considerations such as shipping method, route length, or standard operating procedures. Some companies choose to use the length of live shipments and the period of the actual time period from pickup to delivery for analysis. In all cases, delivery delays should be considered while designing profiles and packaging, and appropriate contingency plans should be defined.
This step in the RCATP process groups the temperature data points from the analysis in Figure 2 into hourly buckets. The first hour of temperature data for all of the above five trips are grouped into Bucket 1, with the second hourly records placed into Bucket 2, and so forth. Each bucket is then displayed as a distribution, with a mark (teal dot) for each temperature data point.
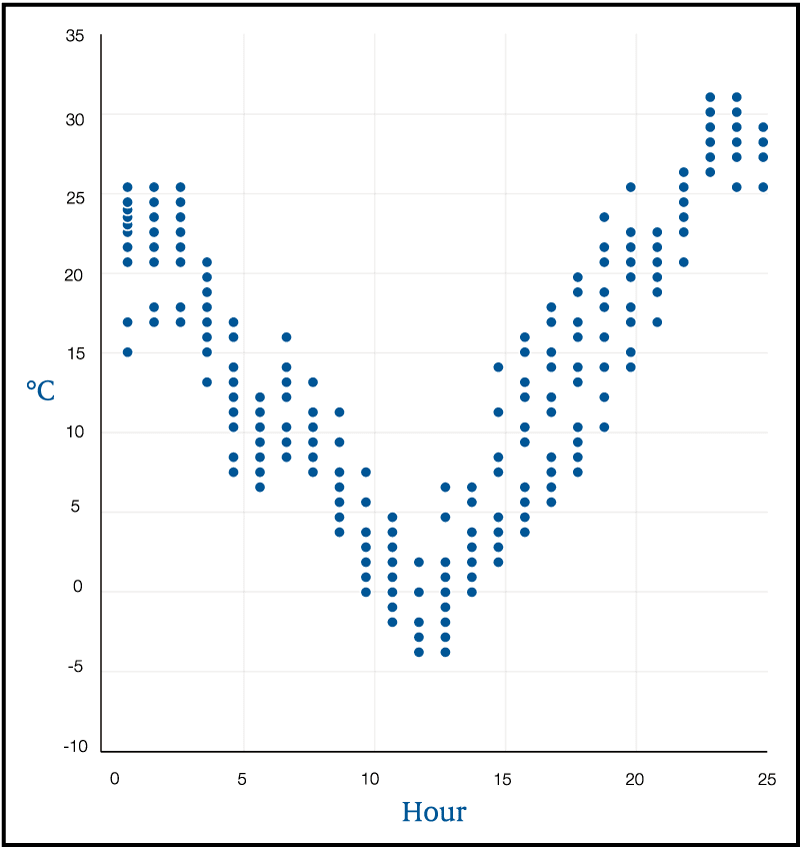
Figure 3: Grouping data into hourly buckets can help companies increase or decrease risk.
Determining acceptable levels of risk
With the information from Figure 3, companies can then establish an acceptable level of risk by assigning an independent percentile for each profile. Within the distribution points, companies can assign a high and low percentile that is based on factors such as risk aversion and product stability that meet their unique product requirements.
This example uses 90% to illustrate how the percentiles relate to each profile. In Figure 4, the first two hours are connected where 90% of the data falls below the line.
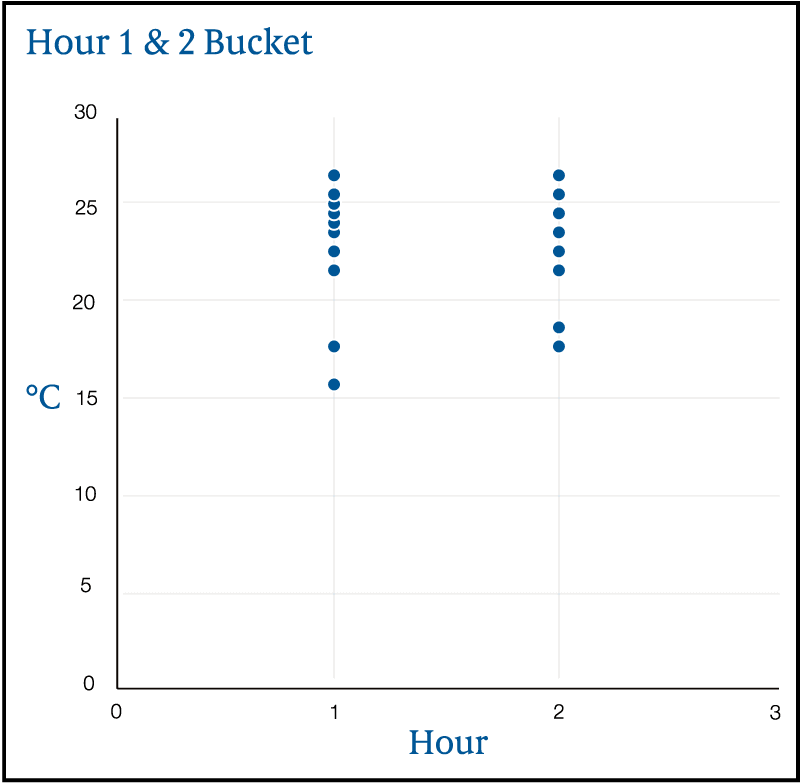
Figure 4: Connecting the first two hours of data
This concept is continued through the entire dataset in Figure 5. Building a lower profile is the same concept, but uses lower percentiles, typically between 0% and 20%. Increasing or decreasing the percentiles will result in more or less extreme profiles.
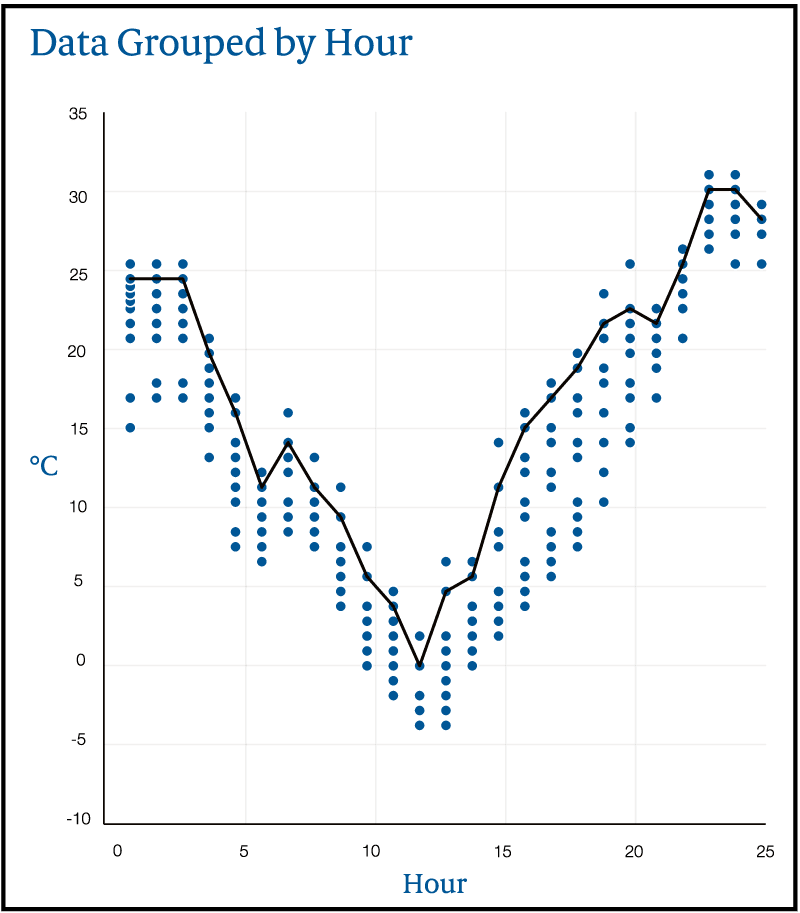
Figure 5: Building the upper profile
Using these percentiles, companies can then see what percentage of shipments they would expect to be at risk of thermal failure by encountering more extreme heat and negative heat values than the package was designed to withstand. This is a critical component of making risk-based decisions not only for package design, but supply chain options as well.
When the percentiles are calculated across the duration of the trip, the result is the two time-temperature profiles. A final profile set with both profiles is seen in Figure 6.
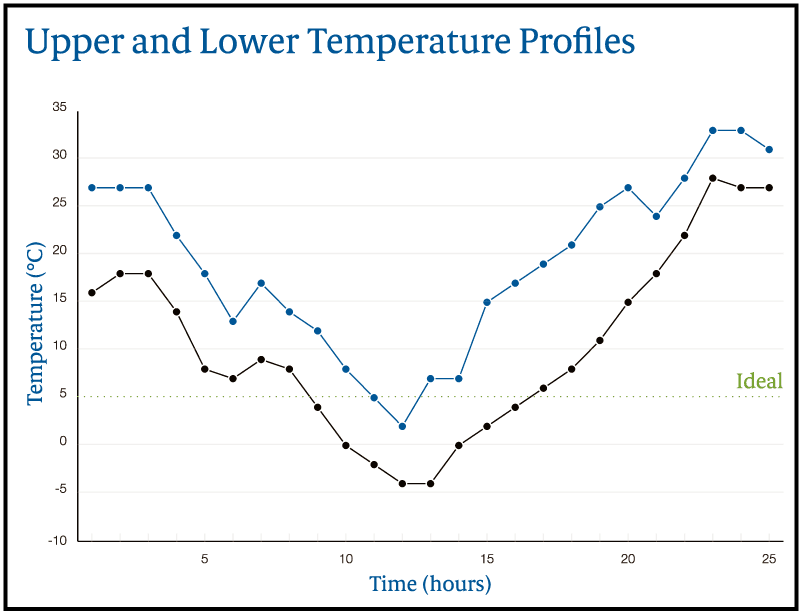
Figure 6: Upper and lower profiles in an RCATP profile set
Why RCATPs are critical to reducing risk
The daily highs and lows of ambient temperatures will continue to be affected by the conditions of transportation—and they will always vary. In truth, there is no surefire way to forecast the conditions that each shipment will encounter. But a dataset from individual actual shipments can be used to generate an ambient profile that is of demonstrable value to the design of tertiary packaging.
The utilization of ambient temperature profiles like the Sensitech RCATP analysis is an effective—and, indeed, essential—way to optimize tertiary packaging solutions for temperature-sensitive shipments. Given the breadth of parameters and the wide range of variables involved, it is wise to continually collect real-world data to help determine the amount of risk in shipping temperature-sensitive products and how to reduce that risk. Repeated experimentation in actual shipping lanes can help to ensure the most accurate guidance for packaging designs.
The speed of transport chosen needs to be taken into consideration as well. While a faster route generally results in a less extreme ambient temperature profile, that generalization doesn’t apply when a shipment unexpectedly ends up spending several hours in the hot Arizona or Saudi Arabian sun, or the freezing cold of Belarus or Alaska.
Taking into consideration the wide array of possible data in an RCATP analysis gives companies the opportunity to optimize a transportation solution and minimize damage and spoilage, maximize efficiency, reduce risk and most importantly, keep consumers safe.
How UPS Helps Customers Optimize Temperature-Sensitive Shipments
To provide its customers with a better understanding of the benefits of a RCATP model, UPS used Sensitech’s methodology for analyzing its own shipping data. In doing so, UPS hopes to provide customers with insights that can help them optimize the engineering and manufacturing of packaging for small, temperature-sensitive shipments traveling through its network.
With the data results from this exercise, UPS customers can gain valuable insights that will help them determine how to use an RCATP to mitigate the risks presented by heat and cold experienced during transport. By more accurately aligning their packaging with the thermal challenges of the network, UPS customers have an opportunity for realizing significant cost savings on packaging, shipping, and reducing rejected shipments.
How the studies were conducted
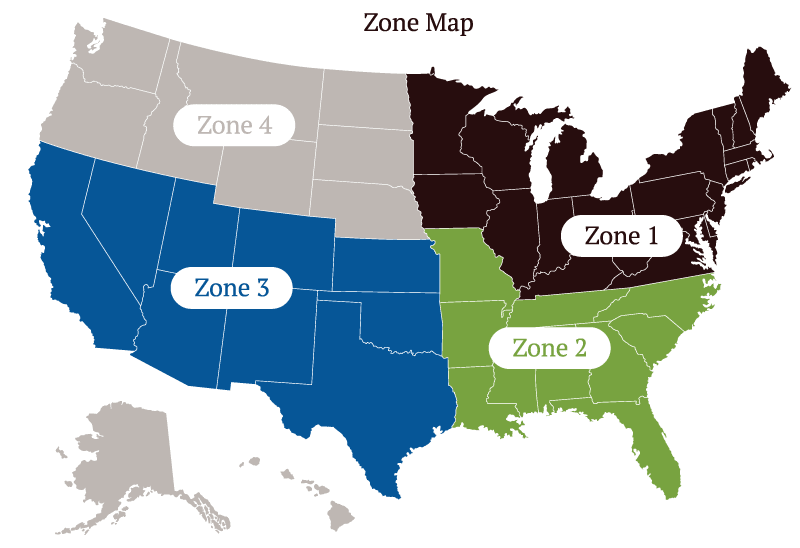
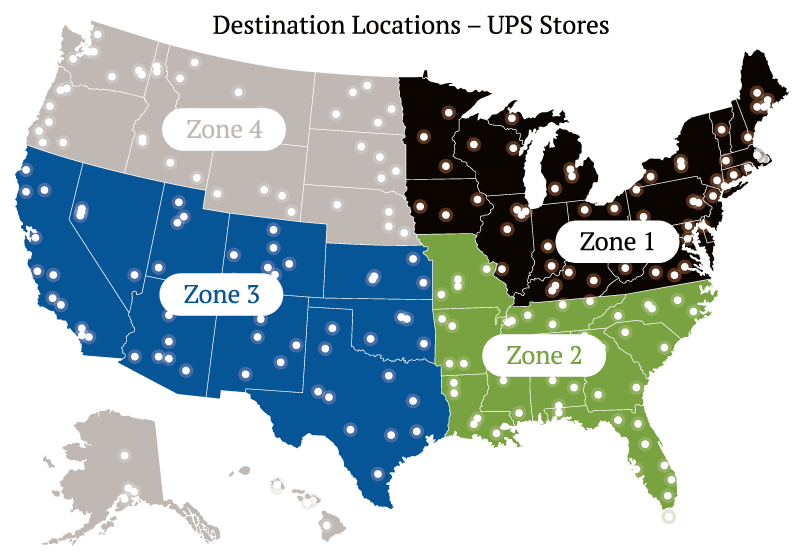
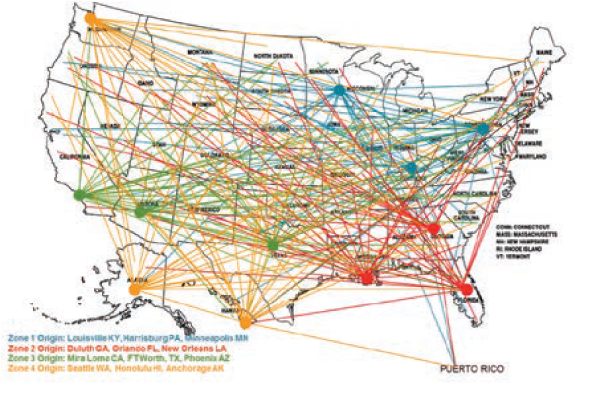
UPS used Sensitech time-temperature dataloggers to collect ambient temperatures across its shipping lanes in the United States. The goal was to capture in-transit ambient temperature data between UPS origin sites and destination locations. To capture temperatures representative of different geographical locations, the United States was divided into four zones. Within each zone, multiple receiving sites were selected and used to create an appropriate geographical spread.
Four seasonal studies were conducted over a period of two years with the goal to capture extreme seasonal variations of shipments while in transit, with data from two summers and two winters. The information collected during these four studies resulted in over 270,000 data points from almost 1.5 million UPS tracked-package miles, and included shipments from 12 points of origin, and over 200 destinations. The data represented both UPS Next Day Air® and UPS Second Day Air® small package services.
The Results: Four RCATPs with UPS Data
To help its customers establish their risk tolerance, the UPS profiles used the 99th percentile of the set of heat values and negative heat values for one summer and winter profile, and the 95th percentile for another summer and winter profile.
With this understanding, UPS customers can select a robust package design, depending on product temperature requirements. The following figures display the four UPS profile sets, one for each study.
- The orange lines in each represent the upper temperature profile (99% or 95%) and the green line represents the lower temperature profile (1% or 5%) in each.
- The horizontal gray line represents the ideal temperature (5°C) established for this study.
- The vertical brown bars represent the maximum and minimum temperatures recorded in each hour group.
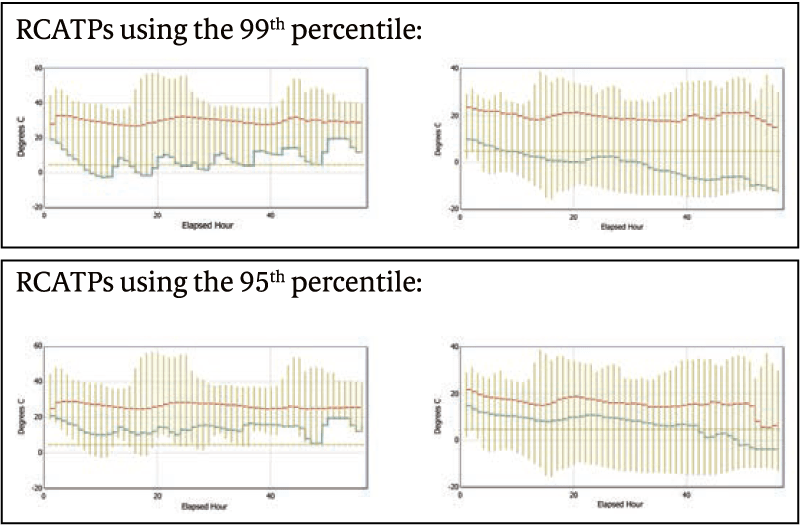
These four profiles show the wide variations that can occur from season to season and from trip to trip, and the level of risk that could be assigned to an RCATP analysis.
RCATPs are critical to reducing risk
The daily highs and lows of ambient temperatures will continue to be affected by the conditions of transportation—and they will always vary. In truth, there is no way surefire way to forecast the conditions that each shipment will encounter. But a dataset from individual actual shipments can be used to generate an ambient profile that is of demonstrable value to the design of tertiary packaging.
The utilization of Ambient Temperature Profiles (ATPs) like the Sensitech RCATP analysis is an effective—and, indeed, essential—way to optimize tertiary packaging solutions for temperature-sensitive shipments. Given the breadth of parameters and the wide range of variables involved, it is wise to continually collect real-world data to help determine the amount of risk in shipping temperature-sensitive products and how to reduce it. Repeated experimentation in actual shipping lanes can help ensure the most accurate guidance for packaging designs.
The speed of transport chosen needs to be taken into consideration as well. While a faster route generally results in a less extreme ambient temperature profile, that generalization doesn’t apply when a shipment unexpectedly ends up spending several hours in the hot Arizona sun, or the freezing cold of Alaska.
Taking into consideration the wide array of possible data in a RCATP analysis gives companies with the opportunity to optimize a transportation solution and minimize damage and spoilage, maximize efficiency, reduce risk and most importantly, keep consumers safe.

